Podcast: Play in new window
Subscribe: Apple Podcasts | RSS
CRITICAL, CURRENT ARTICLES
RATATAT!
- Federal Judge Blocks Biden’s Civil Rights Scheme
- FBI 2A “Audit” DENIED – They’re Not Allowed To Do This!
- ICE Set to Run Out of Funding Amid Record Border Surge
- Lake Mead is 70% empty. More people + less water = bad news
- Judicial Watch files lawsuit for access to Secret Service records on Hunter Biden
- Naval Academy Accused of Teaching CRT, Sued For Records
- Justice Elena Kagan: SCOTUS Losing ‘All Connection … With Public Sentiment’ Is ‘Dangerous’ for America
- More Than Two-Thirds Of Americans Want Term Limits For Supreme Court Justices, Poll Finds
- Law School Dean Suggests Giving SCOTUS Judges Cash So They’ll Retire
- Fauci Poised to Receive Record Federal Retirement Package
- Sinister COVID-19 Vaccine Trials Finally Unmasked
- Woman shooter at Dallas airport has criminal history, tried to rob bank, but was deemed not to be a threat to the public
- Major Swing State Cracks Down On Voter Fraud – This Could Be A Game Changer
- Regretful Fauci says COVID restrictions should’ve been ‘much, much more stringent’, calls to mask kids in schools
- “Serious Adverse Events of Special Interest Following mRNA Vaccination in Randomized Trials.”
AMERICA 2022
- New pics show overcrowded migrant facilities at Biden’s border
- Samantha Bee Wants Leftists to Harass Justice Samuel Alito “For the Rest of His Life”
- California Dem Gov Newsom rolls back law criminalizing loitering with ‘intent to engage in sex work’
- Chicago Mayor Proposes $2.2 Billion Plan to Entice NFL Team to Stay; Bears Moving On to Safer Suburb
CORRUPTION
- Fauci Poised to Receive Record Federal Retirement Package
- Senator demands records after highly credible inside sources reveal widespread effort in FBI, DOJ to downplay negative info about Hunter Biden
- Tucker opens MONSTER inquiry into lies big pharma has been telling in riveting extended show opening
- ‘Highly credible’ whistleblowers exposing widespread FBI, DoJ coverup for Hunter Biden
ECOMONY + FINANCE
Watch These Surprising Signals as the Recession Sets In
By Corey McLaughlin
 We hate to begin today’s essay with a downer…But a recession in the U.S. is all but “official” now. And simply put, that could mean more fear and volatility for the stock market in the weeks ahead. In the first quarter, gross domestic product (“GDP”) declined by 1.6% from the previous quarter. The decline was 8.5 percentage points lower than fourth-quarter 2021 growth of 6.9%.In the second quarter, which just ended, GDP declined again by 1.9%, according to the latest estimate from the Atlanta branch of the Federal Reserve. Pair these realities with a record low in consumer sentiment (because of runaway inflation), and you have enough information to say we’re in a recession. The professional economists haven’t declared it yet, but they should soon – and they almost certainly will if enough people lose their jobs in the months ahead. The point is, inflation is still at multidecade highs… economic growth is slowing… and the markets are expecting these troubles to continue. You can take your pick of supporting evidence. That includes one surprising piece of data…We’ve seen an incredible bull run in commodities over the past year-plus. Now, the trend has turned around. In the May 17 Digest, I mentioned that the Invesco DB Commodity Index Tracking Fund (DBC) – which tracks futures prices on 14 of the most heavily traded and important physical commodities in the world – was up 50% over the previous 12 months. Well, now this fund is down nearly 20% in the past month. And it’s trading below its 50-day moving average (50-DMA), a simple rolling-price measure of a short-term trend. Oil is a big part of the equation. Prices of West Texas Intermediate (“WTI”) crude and Brent crude – the international benchmark – plunged by 9% and 11% on Tuesday, respectively, to around $100 per barrel. This is potentially good if you’re interested in paying less when you fill your gas tank or heat your house – or maybe want to trade what look to be short-term “oversold” levels. But this trend also suggests the market expects declining demand… because of a potential recession. We’re at a new stage of the post-pandemic “recovery” and our ongoing inflation story…This is when the Fed and other central banks play catch-up on inflation, raising interest rates and egging on a recession to bring costs down in the economy.Stansberry NewsWire editor C. Scott Garliss worked for 20 years on Wall Street before joining Stansberry Research. He points out that institutional investors and money managers look six to 12 months ahead when making portfolio decisions, thinking… What will the world look like then? As Scott shared last Friday, he’s seeing signs that professional investors expect economic activity to crater. For example, consider the prices of copper, steel, or aluminum – key raw materials for so many products. As Scott wrote…It’s hard to imagine anything being built without steel or copper used in one form or another. If something we consume isn’t made from steel, the machine that produces it is. And copper has all types of industrial uses because of its resistance to corrosion, ductility, malleability, and electrical conductivity. And today, “Dr. Copper” and other metals are doing poorly…As longtime readers know, copper prices tend to predict big turning points in the global economy… so much so that in investment circles, folks say the metal has a Ph.D. in economics. Clever analogies aside, prices of commodities like copper are in “freefall,” Scott says. You can see it in Bloomberg’s base metals spot price index. And at the start of each of the previous three recessions, we’ve seen the same market behavior…

In the previous examples, each time the Bloomberg index tumbled more than 20%, it was on the front end of a recession. From the peak made earlier this March, the index has dropped over 32%.
The big thing to watch next as the Fed raises rates is how much it hurts the job market…There are a few reasons why. First, people losing their jobs stinks for all involved. Second, the Fed may start to rethink its money “tightening” policies if unemployment spikes. The central bank doesn’t want people unable to pay their mortgages and other loans. The job market is still in pretty good shape overall. The June unemployment rate came in at 3.6% on Friday… holding steady from May. Employers added 372,000 jobs versus expectations of 268,000. And the labor force participation rate ticked down only slightly (to 62.2%).But this will likely change if Fed Chairman Jerome Powell gets his way. And a reversal in policy might take a worse unemployment picture than you’d expect…At a press conference last month, Powell said that as long as it got rid of inflation at the same time, higher unemployment would be a “successful outcome.” So don’t say we (or he) didn’t warn you that more pain could be coming. We can’t know for sure what inflation will look like over the next year or so. But if it’s lower than it is now, we could then see the Fed deciding to cut interest rates to stimulate the economy once again. And on the cycle goes. For now, CEOs of some of the past decade’s biggest growth companies, like Meta Platform’s Mark Zuckerberg, are not hesitating to trim their payrolls… and their workforce… because of tighter profit margins from higher costs and lower growth. Simply put, we’ve gone from “hiring shortages” to the early signs of layoffs pretty quick.
We’re only two years into the 2020s and we’ve already seen…
Soaring inflation. Rising interest rates. Social unrest. A global oil-supply shock caused by war. Political parties accused of trying to rig elections.Maybe it’s also time to dust off your disco balls, bell bottoms, and wide-lapel shirts… As I (Mike DiBiase) will explain today, it’s beginning to look and feel an awful lot like the 1970s.I was just a kid back then. But I remember hearing my parents discussing the news and watching it on our vacuum-tube television in its large wooden console.If you were an adult at the time, you remember the long lines at gas stations just to fill up your tank. Supplies shrank and oil prices quadrupled after the Middle Eastern embargo in response to the U.S.’s support of Israel in the Yom Kippur War.Today, the war in Ukraine and resulting sanctions against Russia have crimped global energy supplies and pushed oil prices north of $100 a barrel for the first time since the fracking revolution.In 1974, President Richard Nixon resigned from office in disgrace following the Watergate scandal. Political division and distrust of the rival party was never more heightened than, well… today.And now, we have rampant inflation for the first time since the 1970s, perhaps that decade’s most enduring legacy… and certainly its largest economic impact. Those years were so bad that they had their own negatively connoted name – the Great Inflation.History sure seems to be rhyming.Even if you haven’t read any of my recent work in Stansberry’s Credit Opportunities or my Digests over the past year or so, you can probably tell where I’m going with this…
I believe we’re going to continue following the same path as we did in the 1970s…
In short, we’re headed for a recession and a period of continued high inflation. It’s a toxic combination known as “stagflation” by economists. The last time our country saw stagflation was – you guessed it – the 1970s.Before I go any further, I realize that not all Stansberry Research analysts share this opinion. That’s OK. Reasonable people can look at the same facts and come to different conclusions.But I invite you to hear me out and decide for yourself. I’m not trying to scare you. These are my honest views. I feel it’s my responsibility to share the information I’d want if I were in your shoes.So I urge you to keep reading.
Early last year, I called inflation ‘the biggest threat to the markets’…
Not many people agreed with me when I wrote that Digest on April 14, 2021.Inflation was less than 2% back then, as measured by widely followed “official” inflation gauges.As you are well aware, inflation has climbed persistently higher to nearly 9% today by these same measures… its highest level in more than 40 years.I knew inflation was headed much higher by looking at one thing… the U.S. money supply – more specifically, the “M2” money supply. It’s all the money in our economy, including cash, checking and savings accounts, money-market accounts, and mutual funds.I saw that the money supply had grown by nearly 30% in a span of a year following the pandemic. It continued to grow by more than 40% over a two-year period.Money-supply growth is the definition of inflation, not increases in prices. Many people misunderstand this.
Price increases are a symptom of inflation, not the cause…
Inflation is caused by the Fed printing new money into circulation out of thin air… an exchange of nothing for something.It’s true that prices of certain things (like oil and baby formula) have gone up recently because of supply shocks. But that’s not “inflation”…Inflation is the general rise in all prices across an economy caused by the expansion of the money supply. Increases for certain goods because of supply shocks are just noise in the overall inflation numbers.The late, great Nobel Prize-winning economist Milton Friedman explained it best…Inflation is always and everywhere a monetary phenomenon.Don’t let anyone tell you differently.When it comes to inflation, we should listen to Friedman. He spent his career studying it across many centuries, countries, and types of economies. He was a big critic of the Fed’s monetary policies in the 1970s that led to that decade’s rampant inflation.There’s always a lot of smoke and mirrors around the subject of inflation. Neither the Fed nor the mainstream financial media is giving you an honest explanation of what it is or what causes it.Friedman is very clear about it. He says inflation is always caused by the same thing – a more rapid increase in the money supply than in the output of goods and services.According to Friedman, inflation has always been accompanied by a rapid increase in the quantity of money. And a rapid increase in the quantity of money has always been accompanied by inflation.The Fed – through its monetary policies – caused today’s inflation. It’s as simple as that. Of course, the Fed will never admit that. It will blame anyone or anything else it can.It has already blamed supply-chain disruptions… the war in Ukraine… and pandemic lockdowns. I’m sure it will blame others in the future, like greedy businesses that are jacking up prices to cover their rising costs, or employees whose wages have grown too fast.Don’t believe any of it.
You need to understand what causes inflation to know where it’s headed…
If you study the money supply, it’s apparent inflation isn’t dropping anywhere near the Fed’s 2% target anytime soon.Here’s why…The last time the money supply even approached today’s pace of growth was the 1970s. From 1970 to 1972 and again from 1975 to 1977, the money supply grew about 30%. The Fed printed the money to fund the Vietnam War and an expansion of Social Security.Now take a look at the chart below… It shows the money supply per unit of output, as measured by real gross domestic product (“GDP”) versus inflation as measured by the consumer price index (“CPI”) over the decade of 1970 to 1980.

You can see that inflation (the black line) always tracks the increase in the money supply (the blue line). Friedman shared a similar chart in a lecture explaining the country’s high inflation back in 1977.It takes about a year for money-supply increases to start making their way into the economy. What’s important is the two lines eventually meet. Either inflation has to rise… or the money supply has to decrease.By 1972, the money-supply increases had finally made their way into the economy. Inflation continued rising to more than 12% by 1974. It took two years and the Fed raising interest rates to 13% to bring inflation down to 5%.But the Fed didn’t learn its lesson and kept printing. Inflation started rising again over the next few years and didn’t peak until 1980 at nearly 15%. This time, it took more than two years and Fed Chair Paul Volcker raising interest rates to nearly 20% in 1981 to bring inflation back down.Let that sink in… It took the Fed at least two years of raising interest rates each time to tame inflation. And the Fed had to raise interest rates higher than the rate of inflation just to bring it down to 5%, more than double the Fed’s 2% target today.Now, here’s the scary part. Here is the same chart over the past 10 years…

This might be the most important chart you see all year.This is the chart Milton Friedman would be looking at today to forecast inflation. The blue line shows the explosive growth in the money supply immediately following the pandemic.Again, this increase didn’t show up in inflation immediately after the Fed switched its printing presses into overdrive. It took about a year before we started seeing the effect in inflation numbers.Since then, inflation has been following the upward path of the money supply. But as you can see, it hasn’t caught up yet.That’s why I believe inflation will continue to stay elevated.
Folks arguing whether we’ve seen ‘peak inflation’ are missing the big picture…
Today, we just learned the latest numbers from the Fed’s preferred inflation gauge – called the Personal Consumption Expenditures (“PCE”) Index. PCE inflation numbers are normally lower than CPI numbers because of the way it weights an assumed basket of goods. May’s PCE reading checked in at a 6.3% year-over-year gain, the same reading as April.Some might take this as a sign that we might be seeing “peak inflation” right now.But month-over-month growth from April to May was greater (0.6%) than it was from March to April (0.2%), meaning inflation is actually accelerating if you look beyond the year-over-year comparison that suggests it might be topping.We’ll see the latest CPI numbers on July 13. If the headline number falls from May’s 8.6% reading, the markets will likely celebrate. But they shouldn’t. It doesn’t really matter if inflation is 8%… or 7%… or even 6%.Like I said, supply shocks around certain commodities are causing a lot of noise in the inflation numbers. If the number falls next month, the Fed will likely credit its tightening policies.Don’t be fooled…Remember, it took more than two years of raising interest rates in the 1970s to bring inflation under control each time. And rates had to be raised higher than the rate of inflation.The Fed just started hiking rates in March. With inflation at nearly 9% today, interest rates need to rise much higher than the Fed’s 3.25% to 3.50% “neutral” target rate for the end of this year to bring inflation under control.We’re more likely to see double-digit inflation before we see it return to 2% – or even 5%.I don’t believe the Fed will have the stomach to follow through on its plans to bring inflation down to its 2% target.
It’s much more difficult – and painful – to reverse the process…
Increasing the money supply is easy. It feels good at first. In 2020 and into 2021, everyone felt richer. The Fed and Congress looked like heroes. The printing presses pulled us out of a recession after the pandemic.But the printing party carried on far too long. It’s an easy trap to fall into. As Friedman put it…When you start drinking or when you start printing too much money, the good effects come first, the bad effects only come later. That is why, in both cases, there is a strong temptation to overdo it – to drink too much or to print too much money.The party is now over. We’re in the hangover stage. Folks have spent their government stimulus checks. Now comes the difficult part.Here’s the Friedman alcoholism analogy again, describing the next part of the story… He said that getting rid of inflation is as hard as kicking alcoholism…When it comes to the cure, it is the other way about. When you stop drinking, or when you stop printing money, the bad effects come first and the good effects only come later. That is why it is so hard to persist with the cure. In the United States, four times in the 20 years after 1957 we undertook the cure, but each time we lacked the will to continue.By “bad effects,” Friedman means slowing growth, rising unemployment, and recession. I expect the Fed will lack the will this time, too. The Fed can only bring down inflation by rapidly decreasing the money supply and raising interest rates. But that’s not going to happen. The Fed’s planned interest-rate hikes and balance-sheet decreases are too small and too slow.That leaves the painful, natural way to reduce inflation… a deep, prolonged recession when economic output and demand fall. That’s where we’re headed.That’s why last December in another Digest, I predicted that 2022 will be the year the markets crash. Few people were talking about a bear market or a recession back then. I explained why it was inevitable.
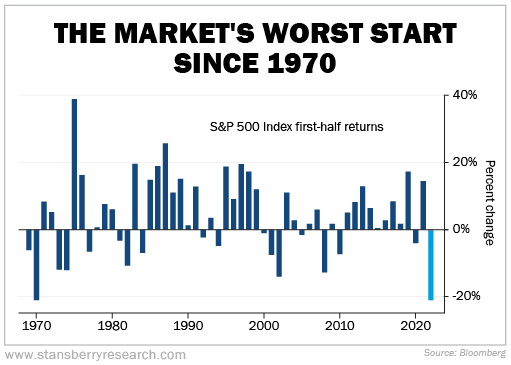
Things are playing out even faster than I expected…
We’re already officially in a bear market… and predictions about a recession are becoming more and more common.The S&P 500 Index is off to its worst start since 1970 (there’s that decade again).
The U.S. benchmark is down more than 20% this year. The tech-heavy Nasdaq Composite Index is down 30%.And we may already be in a recession.Remember, a recession is two quarters of declining GDP. U.S. GDP shrank 1.5% last quarter. This quarter’s number comes out at the end of July. If it shrinks again (as I expect it will), we’ll officially be there.But even if the economy ekes out some small growth to avoid the official “recession” definition, it doesn’t change the direction our economy is headed.
I hate to continue being the bearer of bad news, but things are about to get much worse…
As I’ve shown you, inflation isn’t coming back down anytime soon. Meanwhile, interest rates and U.S. consumer debt continue to rise.Inflation hurts everyone, but it’s a devastating “tax” on lower-income Americans who are living paycheck to paycheck. The bottom 20% of households spend 31% of their after-tax income on gasoline and groceries.Gas prices are up nearly 50% from a year ago. Food prices are up 10%, according to the latest inflation data from the U.S. Bureau of Labor Statistics.Many Americans are now turning to credit cards as they adjust to higher prices. In April, revolving credit balances jumped 20% to a record $1.1 trillion.I believe we are witnessing a slow-motion economic train wreck.Everyday folks will keep getting poorer and poorer with every passing month, as costs rise and the value of a dollar is cheapened. Economic conditions are deteriorating fast for many Americans. And consumer spending makes up nearly 70% of the U.S. economy.Rising prices will eat into corporate profits. The economy will slow. Bankruptcies will rise. Companies will begin laying off workers (many are already freezing their hiring today). The unemployment rate will begin climbing again.In my Stansberry’s Credit Opportunities newsletter, I follow the credit markets closely, as you might imagine from the publication’s title. I expect delinquencies and defaults on credit cards and corporate loans to rise sharply over the next year.As the situation gets more dire, I expect the Fed will give up its fight against inflation and throw in the towel. It will begin easing again – printing money and lowering interest rates.If it does, that just means inflation will take even longer to extinguish.We’re headed toward a deep recession with inflation… in other words, the dreaded “S” word, stagflation. In the 1970s, we went through two painful recessions. The stagflation lasted from 1974 to 1982.I don’t think it will last that long this time, but things are going to get worse before they get better.
That’s why I believe stocks haven’t bottomed…
As my colleague and Stansberry NewsWire editor C. Scott Garliss has explained numerous times over the past month or so in his excellent updates, the earnings estimates for stocks this year are far too optimistic.The market still believes the earnings of the companies in the S&P 500 are going to grow 18% this year. They are 47% higher than pre-pandemic earnings.Clearly, the market hasn’t priced in a recession yet, much less stagflation.I believe we’ll start to see companies guiding down their earnings as we get into the heart of the next quarterly earnings season, which begins in July.These pessimistic changes are going to bring down the market’s valuation.And when we’re officially in a recession, investors will value the market using lower earnings multiples.That’s why I believe we still have at least another 20% to 30% downside in this bear market before it’s over. In short, it’s not time to get bullish on U.S. stocks.
You might think the bond market saw all of this coming…
Historically, the bond market has been seen as “smarter” than the stock market. It normally sees recessions coming first. Not this time.As editors of Stansberry’s Credit Opportunities, my colleague Bill McGilton and I closely follow the corporate-bond market.Bonds are loans. Their principal and interest payments are legal obligations of the companies that issue them. That’s why bonds are considered safer than stocks.The only thing bondholders care about is whether the company will pay them back. So bond investors are good at sniffing out economic downturns that could threaten the safety of these payments.But while the stock market has officially entered a bear market, the bond market is still asleep.Take a look at this chart of the high-yield spread – the difference between the yield on “junk” bonds and U.S. Treasurys – since 1997. The spread is a gauge of bond investor sentiment. (The gray area represents the time since we launched our bond newsletter.)

The spread regularly swings from extreme optimism (below 300 basis points or “bps”) to extreme pessimism (above 750 bps). Today, the spread is around 560 bps. It has been rising all year, but as you can see, it’s still below its long-term average of around 600 bps. It isn’t even near a pessimistic reading.For us, this is not a bad sign, but an opportunity…Eventually, the bond market will wake up. And when it does, everyone will be selling. The bond market is less liquid than the stock market. So when people start selling, bond prices can plunge much further, much faster than stocks.
The coming crisis is the moment we’ve been waiting patiently for…
No one wants to see our country in a crisis. But as Milton Friedman explained, to cure our addiction to easy money, we need to endure some pain. It’s the only way to real recovery.This pain will create incredible investment opportunities for folks who know where to look. You’ll be able to buy these safer corporate-bond investments for pennies on the dollar and earn stock-like returns from an investment whose return is a legal obligation.For example, when the spread briefly spiked to more than 1,000 bps after the pandemic in March 2020, we recommended eight safe bonds that traded at deep discounts. We closed them all less than a year later for an average annualized gain of 59%.This time around, we expect to do even better…We’ve done very well even during the relatively calm times since launching our newsletter back in late 2015. We’ve closed 54 positions for an average annualized gain of 18.2% and an 85% win rate.But it’s during crises that our strategy really shines… When the spread blows out to more than 1,000 bps, investors throw the proverbial babies out with the bathwater and the best opportunities in corporate bonds appear.
ELECTION + VOTER FRAUD
- Conservative Censorship Ramps Up Before Midterms
- Judicial Watch Sues after New York City Fails to Clean Voter Rolls for Years
- Major Swing State Cracks Down On Voter Fraud – This Could Be A Game Changer
FAMILY SAFETY/CHINA: OUR ENEMY
- These Democrats Have AXED Stiff Punishment For Violent Offenders…
- Tucker opens MONSTER inquiry into lies big pharma has been telling in riveting extended show opening
- 2022 Fluoride Action Network Update
- Brutal footage shows 16-yr-old battle NYC cop with blows and chokehold, then city lets him walk
GUN CONTROL
- Armed PATRIOTS – New Poll Shows What People Really Think
- Woman shooter at Dallas airport has criminal history, tried to rob bank, but was deemed not to be a threat to the public
IMMIGRATION
- ICE Set to Run Out of Funding Amid Record Border Surge
- DHS Announces Extension of Temporary Protected Status for Venezuela
- New pics show overcrowded migrant facilities at Biden’s border
- Biden’s DOJ targets Texas’ border control measures, alleging ‘discrimination’
TREASON
- Denial of mass immigration policy realities is exposing the holes in Biden’s bold environmental climate agenda
- Conservative Censorship Ramps Up Before Midterms
- ‘Highly credible’ whistleblowers exposing widespread FBI, DoJ coverup for Hunter Biden
TERRORISM
WOMEN/FAMILY/EDUCATION
CRITICAL, CURRENT VIDEOS
PRESERVE YOUR FREEDOM STAND UP – TAKE ACTION
Link to previous major COVID shows: